All of Opal3's features have been developed in close
cooperation with our customers.
All of Opal3's features have been developed in close
cooperation with our customers.
Title
Track non-financials, financials & risks
Whether you need to track the things that are not so easy to measure, or the money, or your risks, or all of them together, Opal3 has the solution for you.
Title
One-click reporting
Setting up, saving and sharing on-screen reports is made really easy. Just click the report name to run it again with the most recent data.
More formal, regular one-click reports can be be constructed using your own MS Word and Excel documents.
Title
Dashboards
Customise your corporate and executive dashboards, including a P3M dashboard and Risk Profiles.
Each user also has a customisable personal "My Dashboard", showing indicators that s/he is responsible for, including those that belong to her/his subordinates.
Title
Accountability is key - with AI Support
Use your people's expertise to translate data into information and information into actionable knowledge.
Operational and external data are interpreted in the context of broader areas of accountability by the very people who are responsible for delivery.
Artificial Intelligence support is available to provide draft summaries and improve writing.
Title
Automated email reminders
Reminders can be configured to be sent to all users some days in advance of the due date.
Non-reporting can be set to trigger escalation emails.
Title
Quarterly and monthly targets
Both numerical and qualitative targets can be set. Performance can then be mapped over time against targets to show trends as they arise.
Title
Automated data feeds
Standard APIs are available to get data into and out of Opal3. This eliminates the need for double entry and allows your people to concentrate on what they're good at: Providing professional judgment and recommendations, and getting things done.
Title
Microsoft® Word & Excel Templates
Use your own Word and Excel files to create fully formatted reporting templates. A 'mail merge' system then allows you to pull information from Opal3 (numbers, traffic lights, graphs, comments) into your reports.
Featured Content
Featured Content
Title
Artificial Intelligence Support
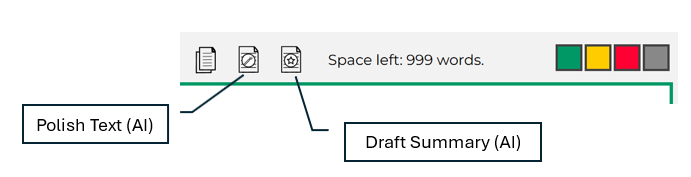
We have gone to considerable lengths to choose an appropriate Large Language Model (LLM) in terms of security, privacy and output.
AI Support is available to all end users.
- The first icon enables a user to "polish" an existing piece of text. The improved version will appear after a double dash under the existing text
- The second icon provides a draft summary of any contributing lower level indicators.
Clients have the ability to edit the default prompts for the LLM, as well as provide additional instructions for defined sets of indicators.
Title
The Corporate Dashboard
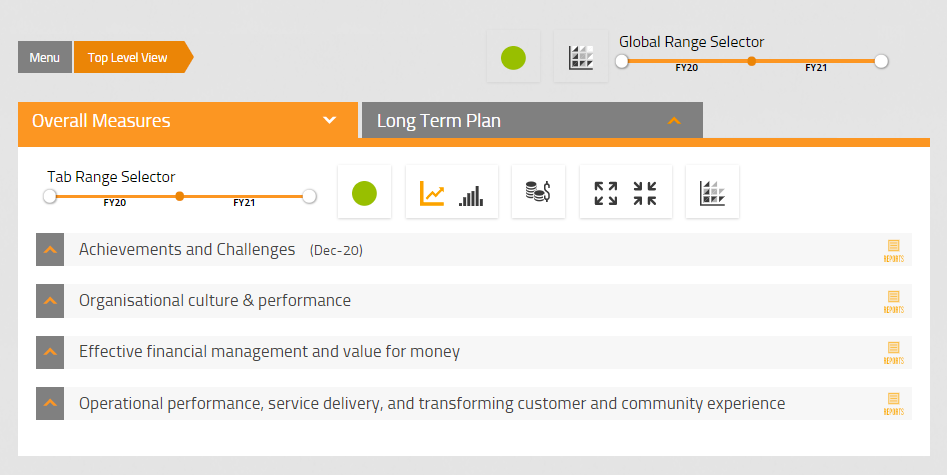
The Corporate Dashboard shows key performance information
- All tabs, sections and content can be tailored to requirements
- The dashboard can show non-financial, financial and risk information
- Information is shown in graphical format, including time series
- Variance commentary and recommendations for improvement are shown for each indicator.
- Personal dashboards are also available
Title
The Change Matrix
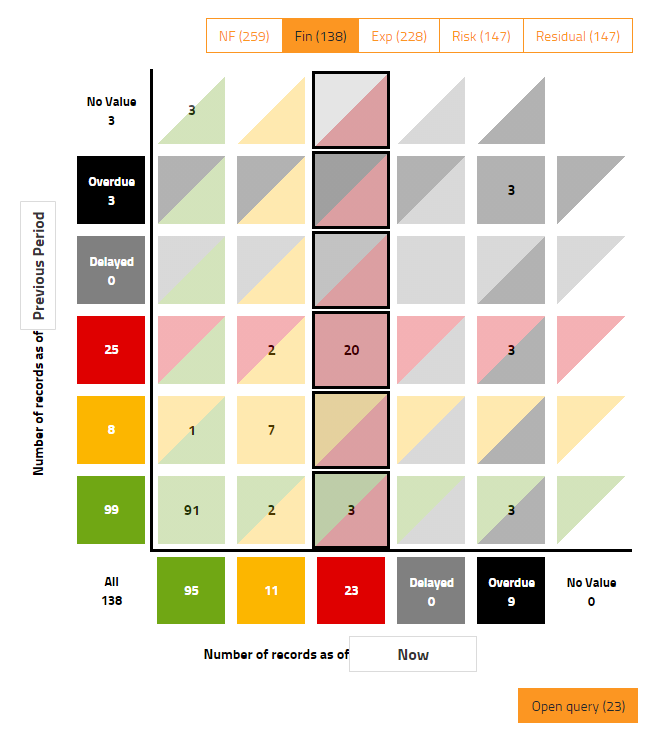
This Dashboard shows change over time, from a traffic light in one period (y-axis) to another, later period (x-axis).
- The selector at the top is set to Financials only. Additional filters are also available.
- The selected column shows all indicators that are currently red / off target.
- Clicking on the "Open Query" button will provide detailed results for the selected indicators.
Title
The Risk Profile
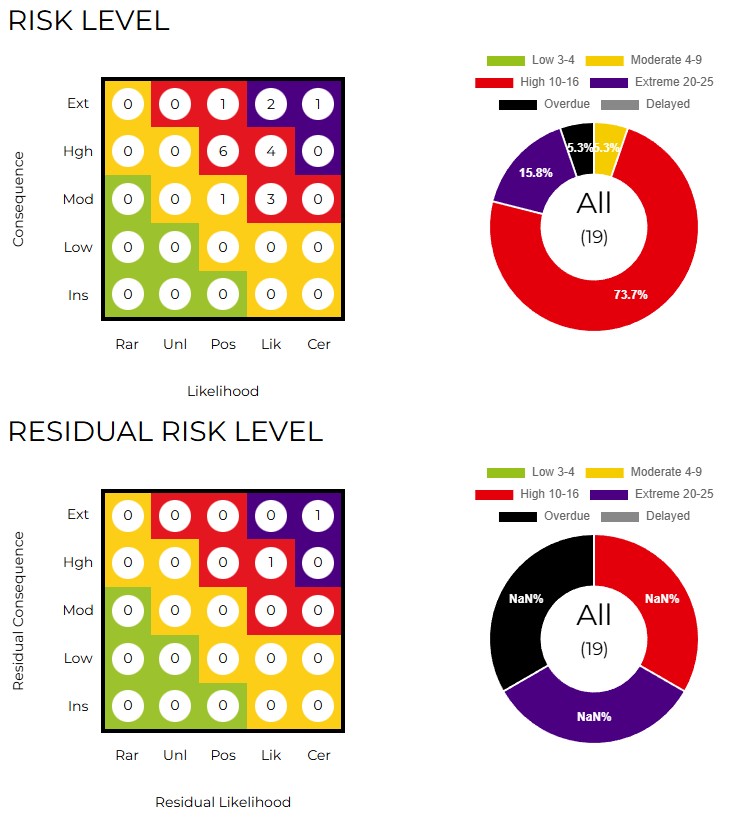
This dashboard focuses on the risks of the organisation.
- A wide range of filters can be applied.
- Clicking on any cell or pie chart section provides detailed information.
Title
Personal Dashboards
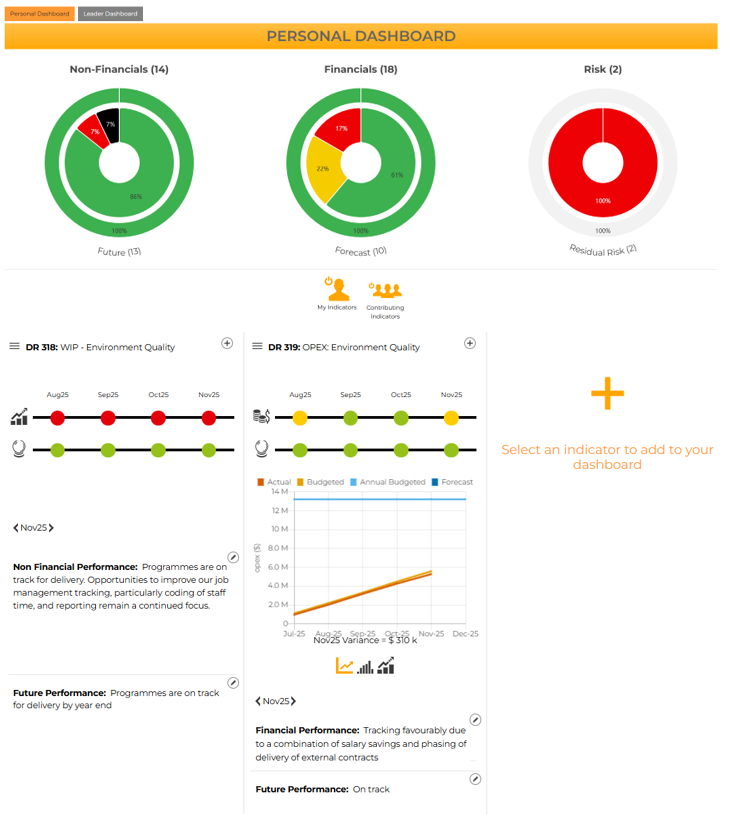
"My Dashboard" shows each user's area of responsibility
- Information is shown for non-financials, financials and risks
- Toggle buttons allow for selection of personal accountabilities, subordinates', or both.
- Chart segments lead to detailed reports
- Users can add "feature" indicators to provide more immediate information below the dashboard
Title
On-screen Reports
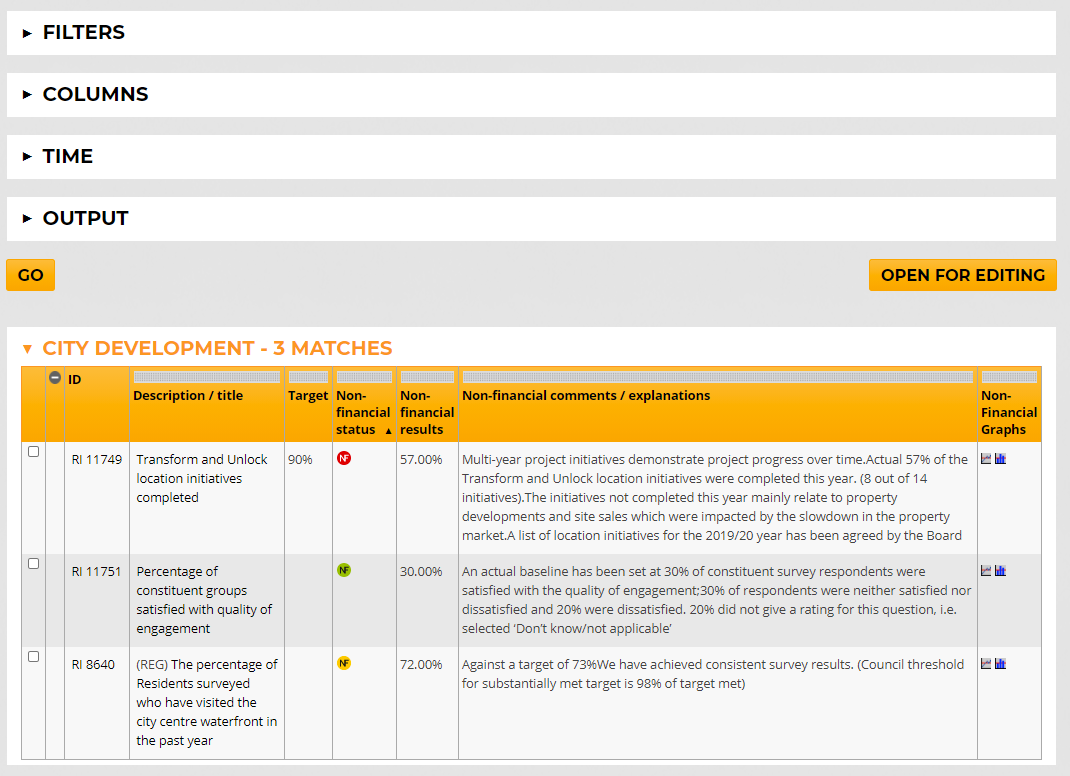
All performance information can be viewed, selected and managed on screen.
- Choose your filters, columns, time slice (incl time series) and output format
- Review and manage
- Save any useful Reports for regular display and discussion
Title
Corporate Reporting Templates
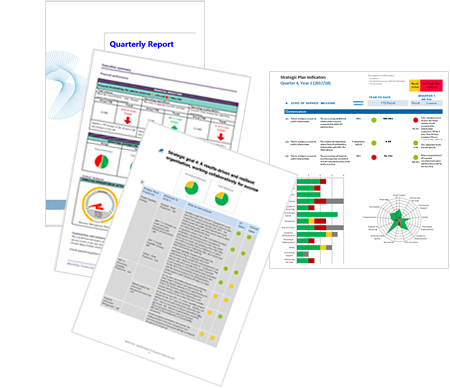
Create and manage your own Corporate Report Templates
- Tailor your Corporate Reports using MS Word or Excel
- Use our dedicated mail-merge system to populate your templates with data from Opal3
- Reports remain fully editable
- Quarterly and Annual Reports have never been this easy!
Title
Accountability rules!
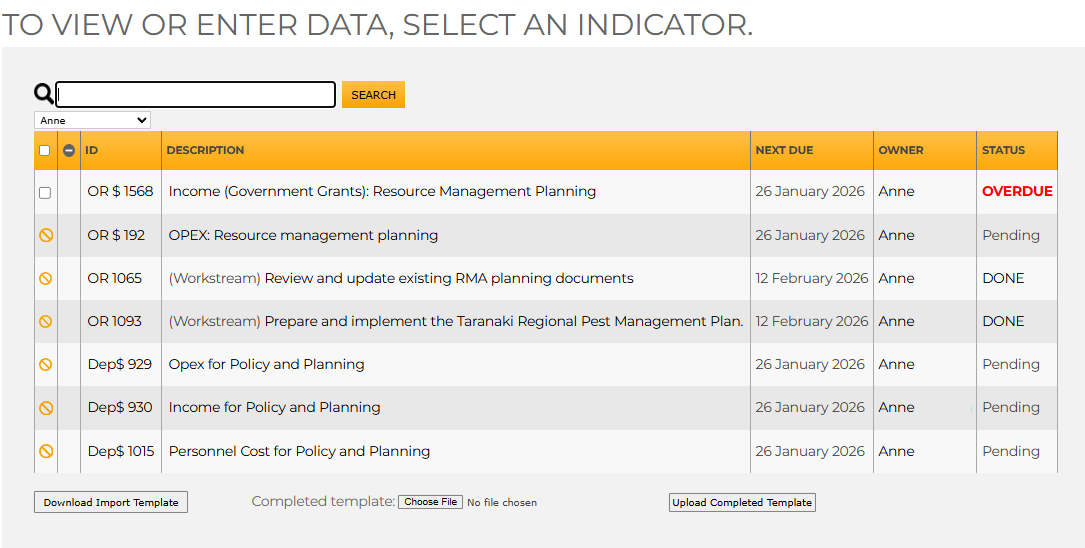
Foster a sense of accountability with regular and common sense reporting
- Automated email reminders with user defined time frames
- User defined targets and reporting frequencies
- Data can be provided automatically by external systems
- Results can be rolled up to higher levels
- Managers provide assessment and recommendations (AI Support is available)
Title
Traffic Lights
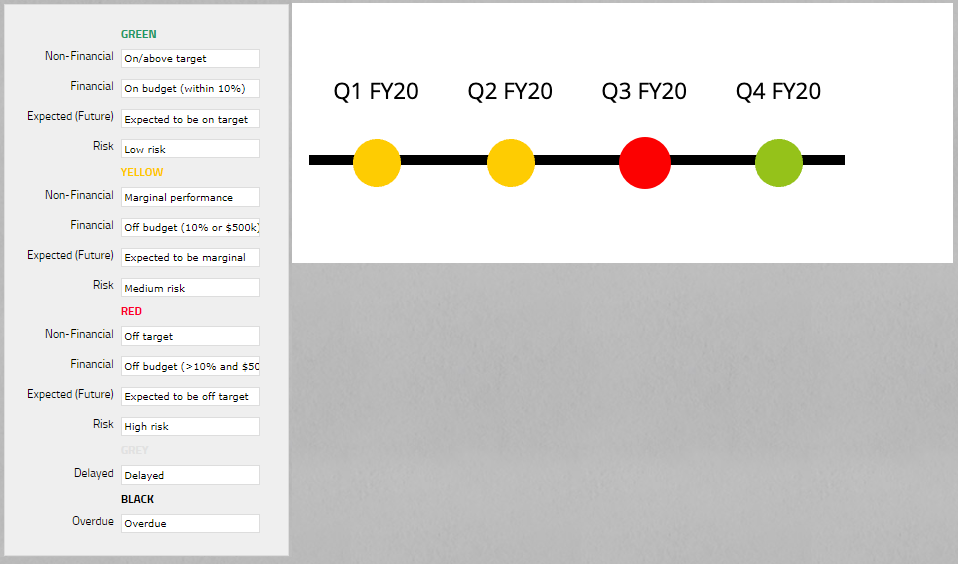
Traffic lights can either be automatically assigned via specific criteria, or can be left to the decision of accountable personnel.
Title
Integration with source systems & access

- Data Uploads & Provisioning
- Via API (recommended)
- Via Spreadsheet
- Single Sign On